TEXSTAN
Institut für Thermodynamik der
Luft- und Raumfahrt - Universität Stuttgart
Mechanical Engineering
- The University of Texas at Austin
- home |
- overview |
- modeling |
- boundary layer |
- pipe flow |
- turbine blade
computational results
The laminar pipe flow problem supports CHMT problem 7.9 (for momentum transfer) and 8.21 (for heat transfer - modified to be a combined entry flow problem rather than an unheated starting length flow problem). The thermal boundary condition for this problem is a constant surface temperature, designed to heat the fluid (Ts / Tm > 1). The problem assumptions include constant properties and neglect viscous dissipation. The flow is laminar because the Reynolds number is 1000. The temperature ratio and Mach number (air as an ideal gas) for this problem at the inlet (note - the mass-averaged temperature is tref and the mass-averaged velocity comes from s30.ftn82.txt) are
- Ts / Tm = (310.0)/(300.0) = 1.033
- M = um /(γRTm)0.5 = (0.22)/ [( (1.4)(8314/28.97)(300)]0.5 =6E-04
These calculations support the constant properties assumption and that it is ok to neglect viscous dissipation.
Momentum Transfer Results - These computational results are validated primarily by analyzing the hydrodynamic entry region and the approach to hydrodynamically fully developed flow.
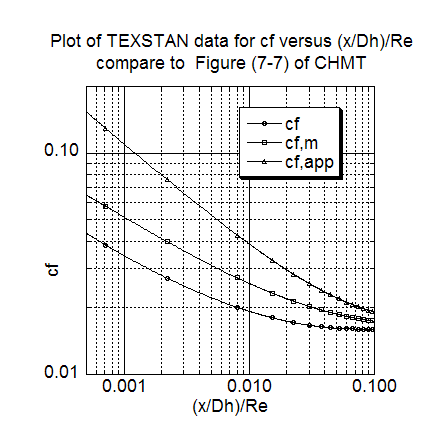
The first momentum transfer result is a comparison of three different friction coefficient formulations, computed as a function of the (x/Dh)/Re parameter. The results can be qualitatively comparison with Figure 7-7 (CHMT 4th ed.)
note: the local friction coefficient, cf defined by Eq. 7-22 (CHMT 4th ed.), is extracted from s30.ftn85.txt; the mean friction coefficient, cf,m, is computed by integrating the local friction coefficient data according to Eq. 7-22 (CHMT 4th ed.); and the apparent mean friction coefficient, cf,m defined by Eq. 7-21 (CHMT 4th ed.), is extracted from s30.out.txt when it is reformulated by setting flag kout=4; the parameter (x/Dh)/Re is the conventional parameter for demonstrating the hydrodynamic entry region, and it is the inverse of the Langhaar parameter that is the abscissa variable in Figure 7-7 (CHMT 4th ed.) and which causes the curves in Figure 7-7 to ascend rather than descend along the abscissa - (x/Dh)/Re permits the curves to descend towards their hydrodynamically fully-developed values.
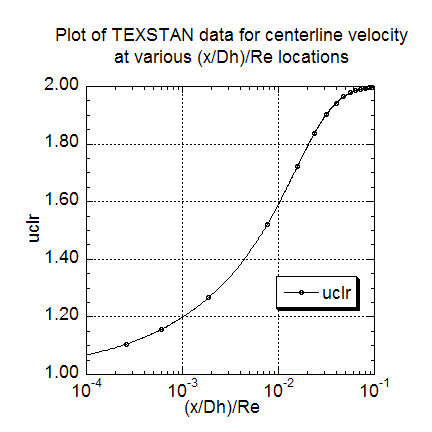
The second momentum transfer result is the plot how the ratio of centerline velocity to the mass-averaged velocity (or mean velocity) ratio, uclr, changes as it approaches its hydrodynamically fully-developed value. The ration is plotted versus (x/Dh)/Re parameter, and the results can be compared to the (r/rs)=0 values of Figure 7-6 (CHMT 4th ed.). The TEXSTAN results for this plot are extracted from s30.out.txt
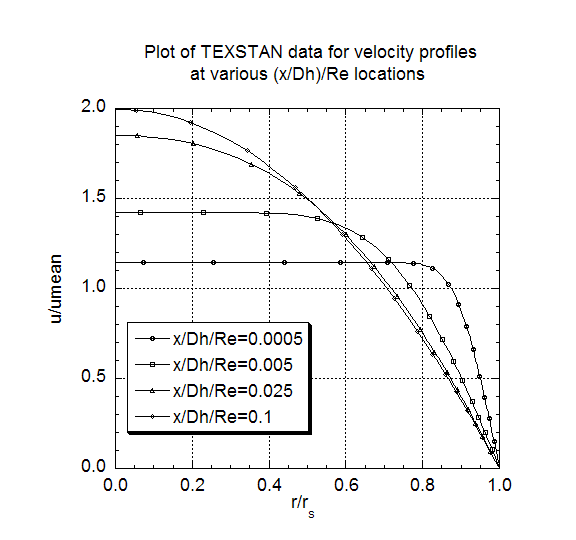
The third momentum transfer result is the plot of a set of velocity profiles, nondimensionalized using the mass-averaged velocity umean, at selected nondimensional (x/Dh)/Re locations. These profile results can be compared to Figure 7-6 (CHMT 4th ed.) to demonstrate the approach of the flow to its hydrodynamically fully-developed condition where the profile shape stops changing, at (x/Dh)/Re ~ 0.1. The plot values of (u/umean) at (r/rs)=0.0 track the plot of uclr. Note that the profiles were generated by resetting flag kout=4 and k10=10 in s30.dat.txt.
Heat Transfer Results - These computational results are validated primarily by analyzing the combined thermal entry region and the approach to thermally fully developed flow.
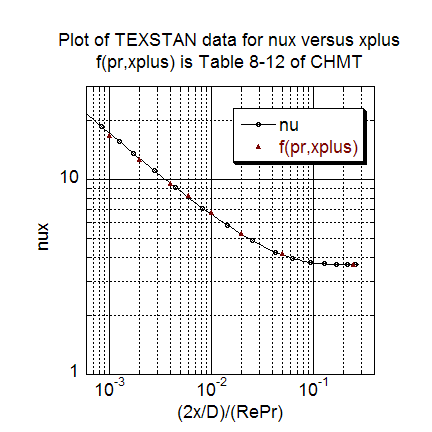
The first heat transfer result present nondimensional heat transfer it the form of the local Nusselt number as a function of the xplus = 2(x/Dh)/(RePr) parameter. The results are compared with Table 8-12 (CHMT 4th ed.) where the dataset Pr is =0.717 and the table value is =0.7 (a slight mismatch, tested using TEXSTAN to show negligible differences because of the Pr mismatch, 0.08 percent in Nusselt number in the early entry region). The TEXSTAN results for this plot are extracted from s30.out.txt with kspace=5.
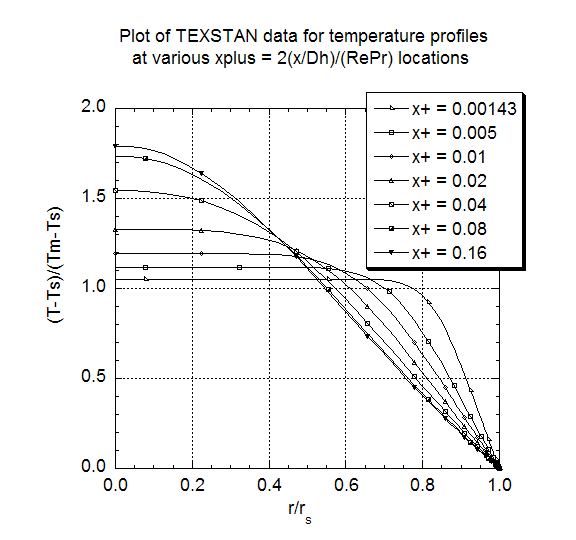
The second heat transfer result is the plot of a set of temperature profiles, nondimensionalized into the theta parameter,

where Tm is the mass-averaged temperature and Ts is the surface temperature, both functions of the axial flow direction. The graph of these profiles demonstrate the approach of the flow to thermally fully-developed flow state where the profile shape stops changing at xplus ~ 0.1 to 0.15. When the profile becomes constant we can show that the heat transfer coefficient also becomes constant, as seen in the Nusselt number plot. Note that the profiles were generated by resetting flag kout=4 and k10=10 in s30.dat.txt.
The test for thermally fully developed flow is when this nondimensional temperature profile becomes independent of x. A requirement for thermally fully-developed flow is that fluid properties remain approximately constant, which means the flow must be either isothermal or if there is heat transfer, the heating or cooling rates must be low enough to not cause appreciable change in the ratio of the mass-averaged temperature to the surface temperature. Note that the flow must become hydrodynamically fully-developed before the flow can become thermally fully developed.
At this time there are no graphics associated with TEXSTAN, although the output files are designed to permit importing into various graphical packages; these plots have been carried out using the superb, user-friendly plot package KaleidaGraph from Synergy Software.
website updated Sept 2010 © 1996-2010 Michael E. Crawford - all rights reserved - website validated for CSS 2.1 and XHTML 1.0 strict at www.w3.org
